
Litter in the Streets
What explains cross-national differences?

The first time my wife and I visited Morocco was thirty years ago. We spent a week in Fes. I was just at the beginning of Cliodynamics (in fact, the name was coined several years later). Visiting Fes was like going back to the fourteenth century when Ibn Khaldun was writing his monumental book on universal history, Muqaddimah.
We are now going to live for a month in Marrakesh, and I am very interested in exploring this lovely city, full of history, and seeing how much (or how little) Morocco has changed over the past three decades.
Spending a month in a country is not enough to gain any deep understanding of it. It takes many years of living and working in a country, and interacting with its officials, banks, and other organizations to really understand it. Still, there are certain surface indicators, which, even if very superficial, provide useful insights.
One thing that strikes a visitor to a lower income, or even middle income country (like Morocco) is the degree of “shabbiness” — the condition of the buildings, roads, and public spaces. Most important, how much litter is found on the ground. Having just arrived from Vienna, which is a remarkably well-kept city, the first thing that struck me on arrival in Marrakesh was the amount of plastic waste littering the streets and open spaces. Here’s a fairly typical sight: a mountain of trash in front of a rather palatial residence.
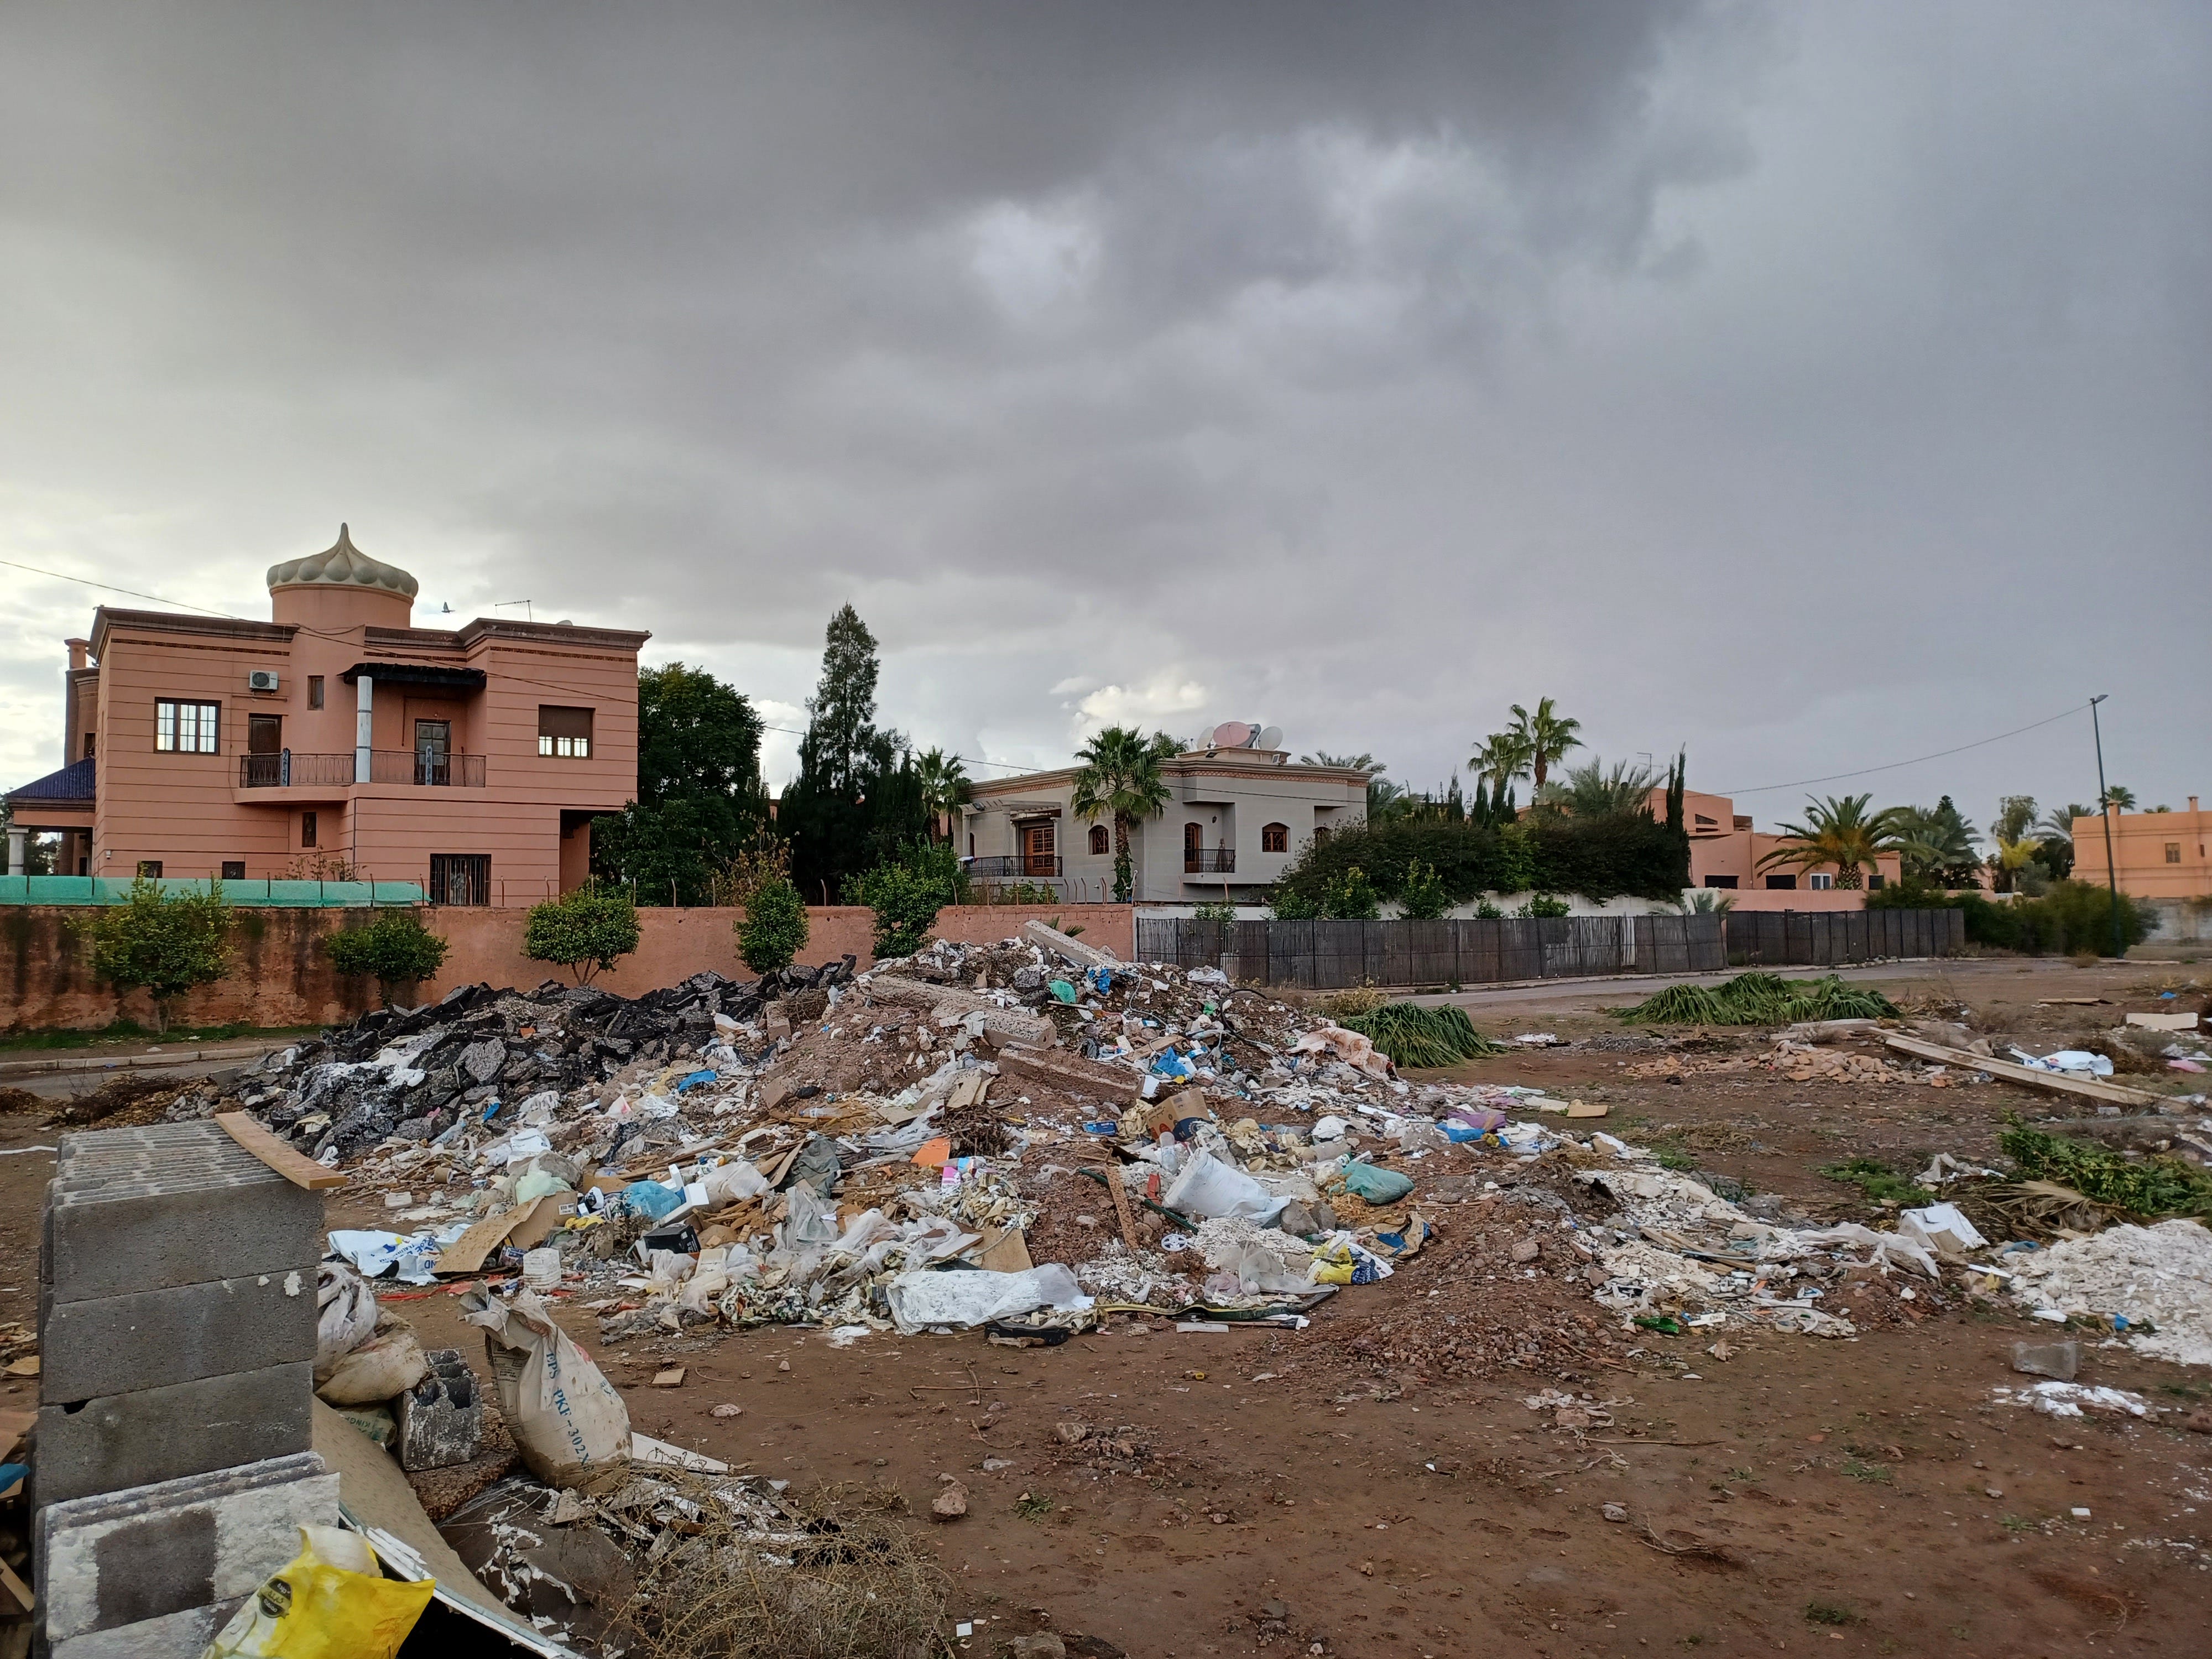
Photograph by the author
I think it’s not too far a stretch to suggest that the degree of litter in the city streets provides us with one of the proxies for how functional and cooperative a society is. It’s an imperfect indicator, but still worth considering.
Let me tell you a story to illustrate this point. In 2016 we rented for several weeks a rural house in Sicily, in the vicinity of Palermo. The house was up on a hill, and the beach was a 10 minute walk down (or 15 minute climb back up). It all was wonderful, except on the way one had to go by a huge smelly mountain of garbage (see the photo below).
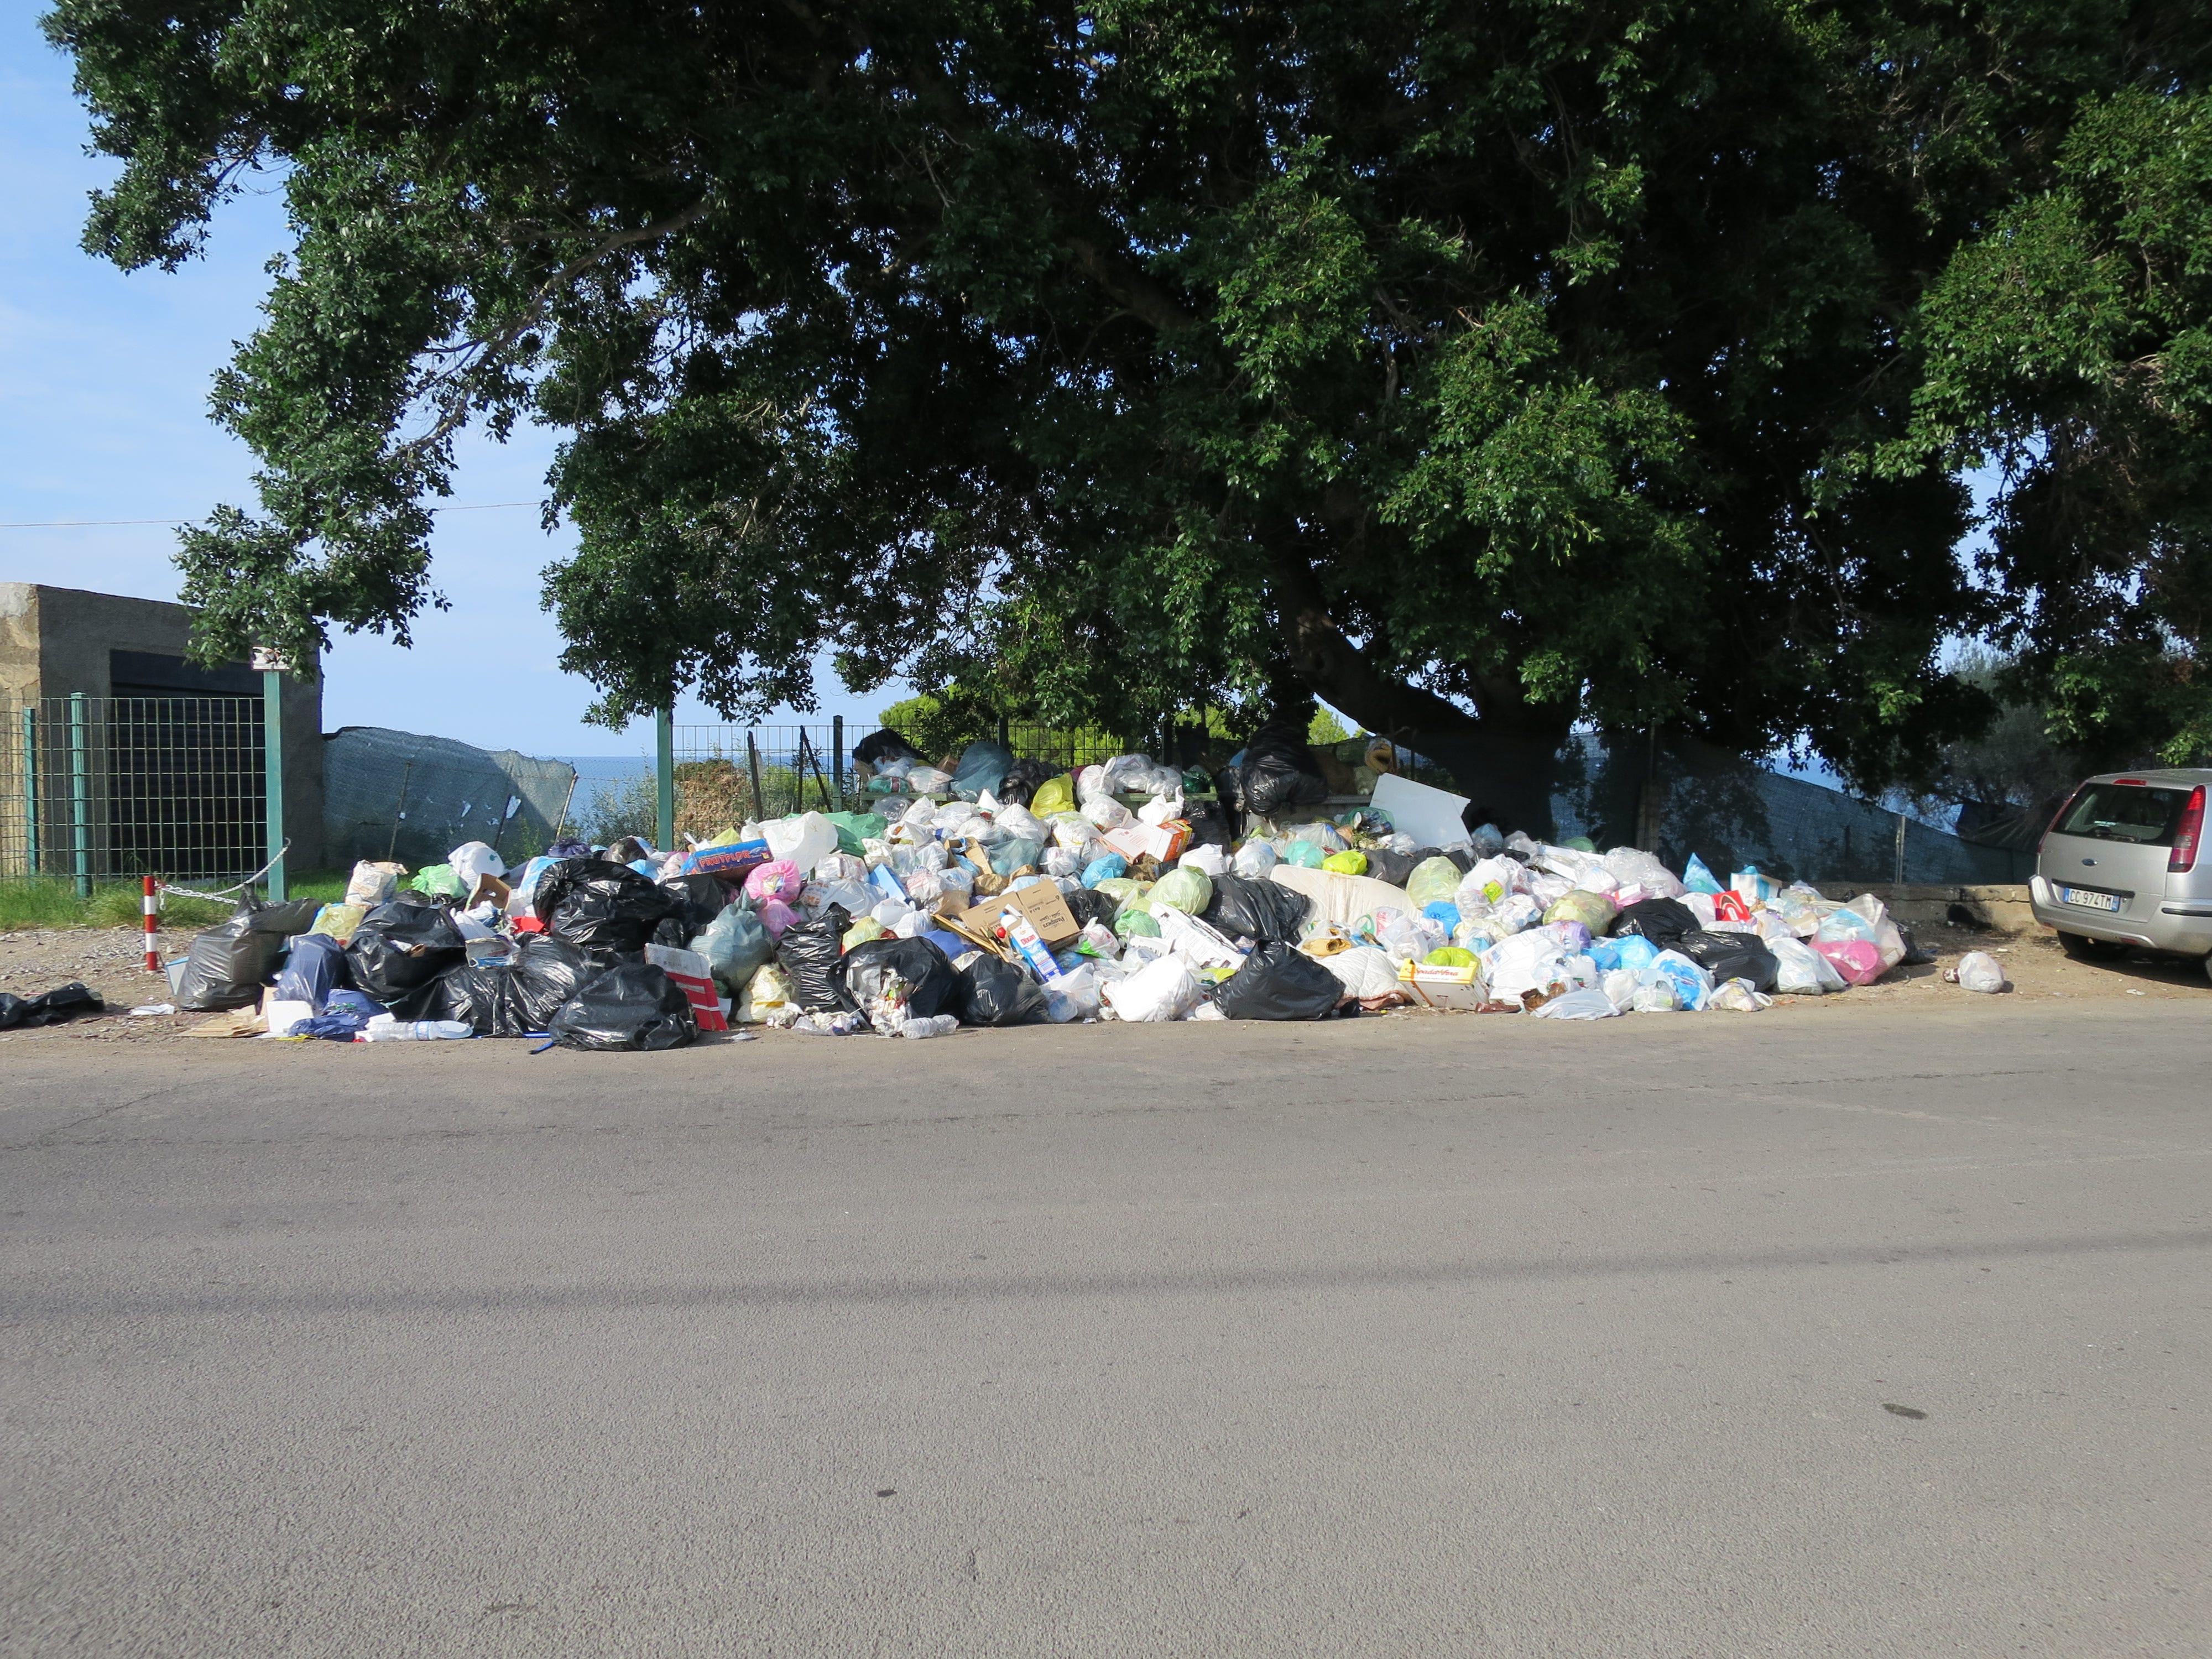
Photograph by the author
I asked our landlord about it, and he told me this was a result of a conflict between the municipality and local mafia — they couldn’t agree on how much the town was to pay for garbage removal. The trash heap continued to grow during our stay there and only got smellier under the hot Sicilian sun (read here about the Italian Ecomafia).
Ecomafia gives us a specific explanation for southern Italy, but what explains the variation in the amounts of litter on the streets among the countries in the world? I asked ChatGPT about it, but it was unable to find any good academic analyses of cross-national patterns. It did, however, point me to the chart by Our World in Data, Mismanaged plastic waste per capita vs. GDP per capita, 2019, which is reproduced below.
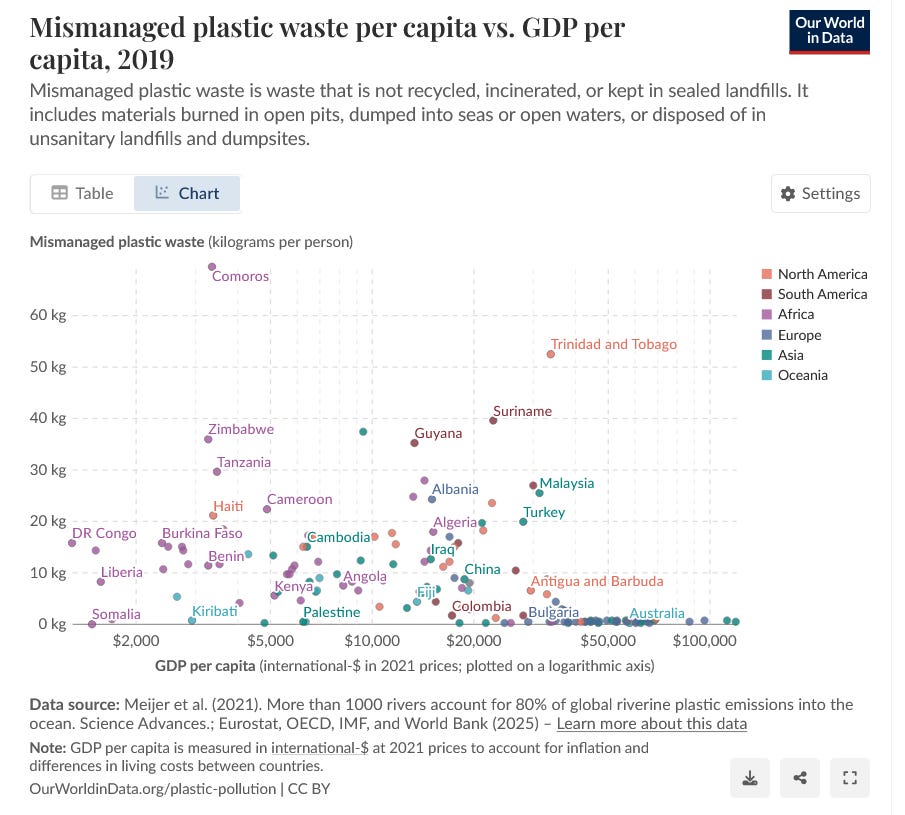
I must say that I was unpleasantly surprised by how uninformative this plot is, so I downloaded the data and plotted it myself. Because each variable (waste and GDPpc) varies by several orders of magnitude, we need to plot the data on a log-log scale to be able to see if there is a pattern. Here’s what such a double-log plot looks like:
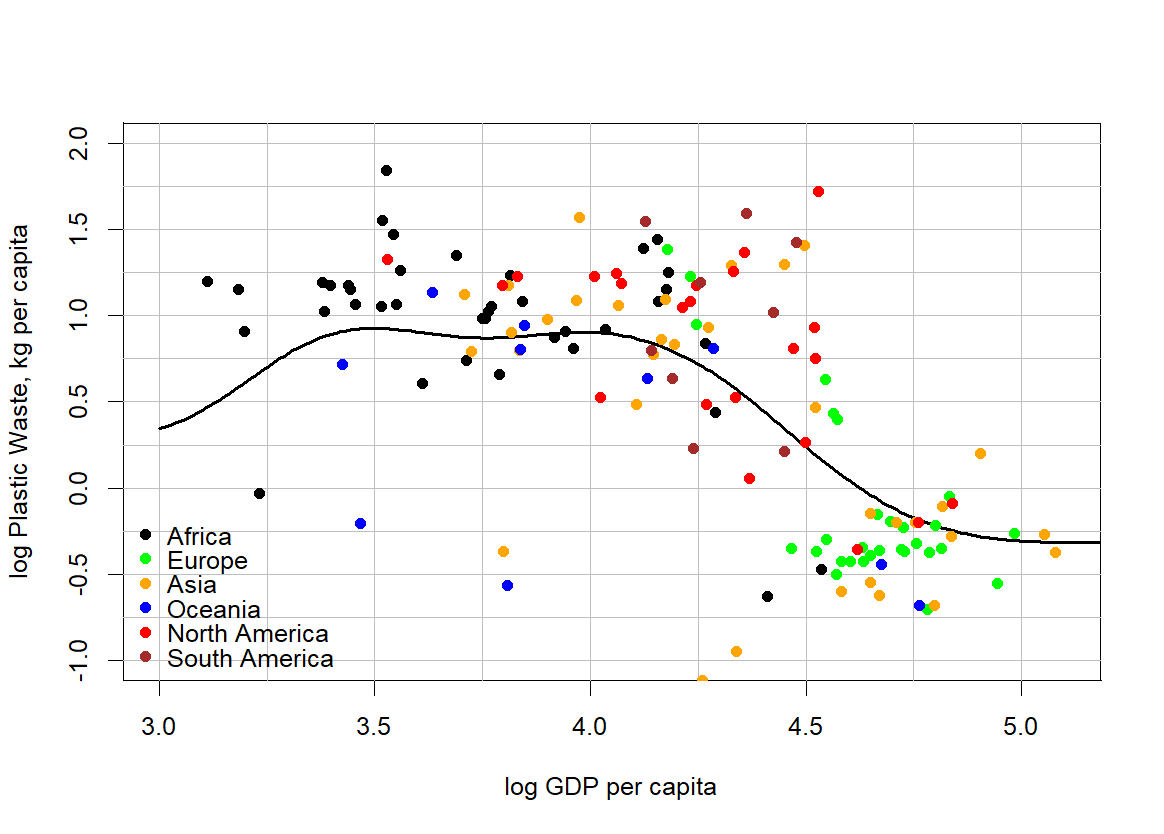
As I am using base-10 logarithms, “1” corresponds to 10 and “4” corresponds to 10,000 (basically, it’s the number of zeros). The black curve is the smoothed trend.
There is a lot of variation, but the overall pattern is pretty clear. For the range of log GDPpc between 3 and 4.5 (that is between $1,000 and $30,000) countries generate around 10 kg of mismanaged plastic waste per person. Once you get above GDPpc of $30,000, production of mismanaged waste drops quickly to around 0.5 kg per person. Interestingly, this transition is seen not only in Europe (green dots) and North America (red dots), but also in Asia (orange dots).
The pattern in the data is interesting, but it answers my question (what accounts for different levels of street litter among world countries) only partially. There is a lot of variation around the trend (the black curve). Also, I didn’t delve into the data provenance (data come from an article by Meijer et al. 2021). Perhaps some readers would suggest further ideas or data.
I think it might become more informative if you exclude small island nations, which sometimes simply don't have space for landfills etc.
It's also worth noticing that arid places tend to look more "trashy" because the garbage doesn't rot or get washed away by water.
In Morocco there is a lot of difference between cities, with Arab cities notably different from Berber ones, and those N of the mountains from those to the S.
Litter looks like a surface proxy for coordination equilibria. Above a basic income threshold, the variance isn’t about resources but about whether responsibility, enforcement, and expectations are mutually legible. Where coordination collapses, even simple collective goods fail.