
Empirical Cliodynamics: the Use of Proxies
The Archaeology of Novgorod the Great

Some weeks ago I was interviewed by 632nm Podcast, who did a pretty good job, I think. They were not afraid to delve into technical details, so I could explain the scientific foundations of Cliodynamics in more detail than in a usual interview. Below is an excerpt where I discuss a specific example illustrating the use of “proxies” — indirect indicators that allow us to measure quantitative processes in history (in this case, population dynamics). You can either watch the interview segment, or read the text following it, or both.
An example of archaeological data that is both well resolved in time and gives us a good proxy for population numbers comes from the medieval city of Novgorod the Great in northwestern Russia.
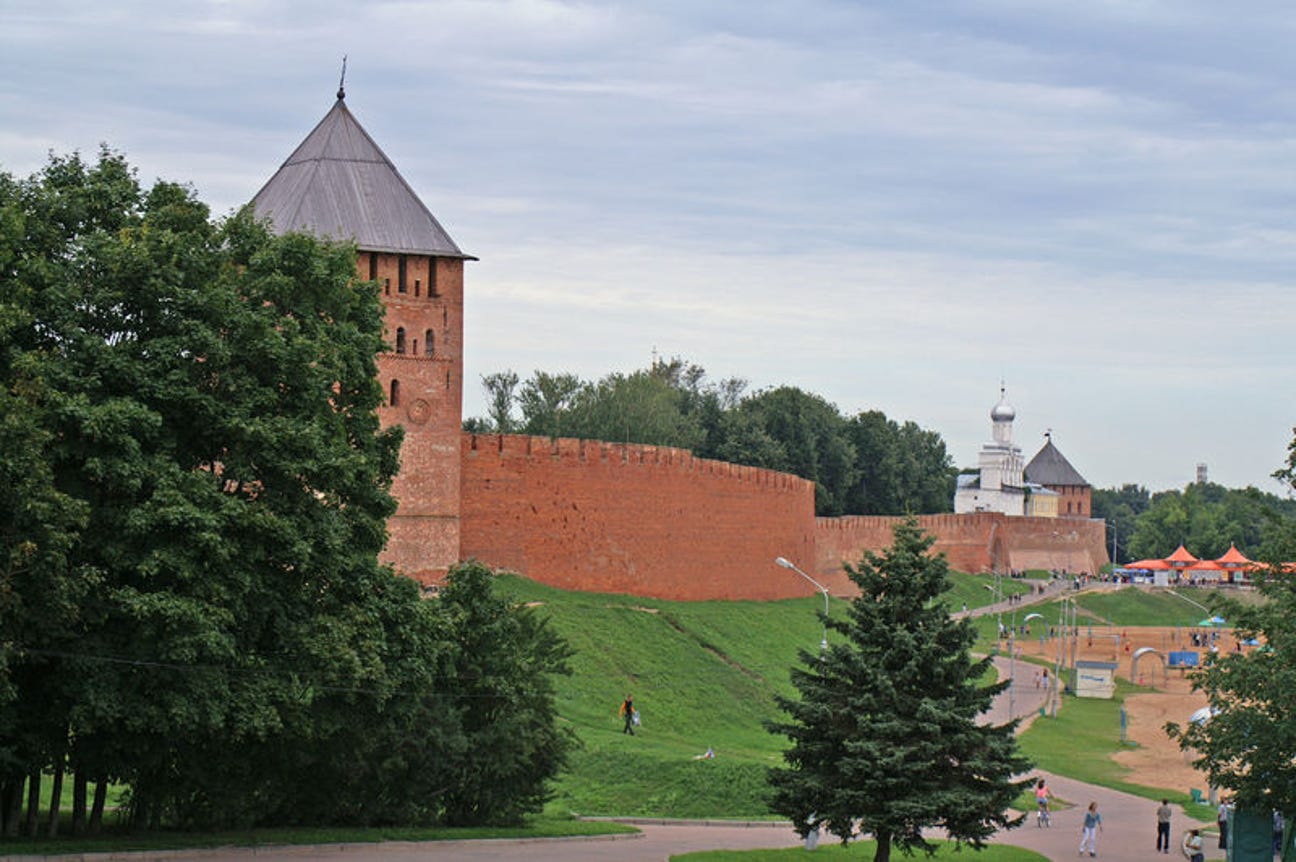
Novgorod is located in a very wet and cool environment. In the middle of the tenth century the Novgorodians became tired of constantly wading through the mud, and paved the streets of their city with huge wooden planks. This worked for a while, but the soil level slowly rose because of accumulating anthropogenic rubbish, and some twenty years later the streets again became muddy. The Novgorodians then put another layer of street paving on top of the old one, and continued doing so at intervals of 20–30 years throughout the next six centuries.
Because of the cool and humid environment all layers of wooden pavements were perfectly preserved. Twentieth century’s archaeologists dated each layer using dendrochronological methods. As a result we have an unusually well resolved stratigraphy for Novgorod with the time step of roughly one human generation.
If we look at the rates with which various kinds of “stuff” accumulated in Novgorod’s soil, we observe two clear peaks, one during the twelfth century and the second around 1400. The decline during the fifteenth century is real, but the one after 1500 is an artefact. Unfortunately for archaeologists, a drainage system was installed in Novgorod in the early modern period, as a result of which the post-1500 cultural layers became aerated and all organic matter in them decomposed.

The rate of deposition of various kinds of anthropogenic rubbish in Novgorod: leather shoe remnants, broken locks, discarded pieces of cloth, and lost amber ornaments (mainly beads). Each data series was normalized by scaling to mean = 1 in order to fit on the same graph (after Figure 6 in Turchin, P. 2009. Long-term population cycles in human societies. Pages 1-17 in R. S. Ostfeld and W. H. Schlesinger, editors. The Year in Ecology and Conservation Biology, 2009. Ann. N. Y. Acad. Sci. 1162.)
It is reasonable to suggest that the greater the population density in the city, the more rubbish they generate. If people wear out shoes at an approximately constant rate, the more people there were during a certain period of time, the more discarded shoes archaeologists would find in the corresponding cultural layer. The general (although not perfect) agreement between the trajectories of the four kinds of stuff shown in the figure suggests that there is a real signal indicating population changes. Averaging the four data series we clearly see two population cycles:
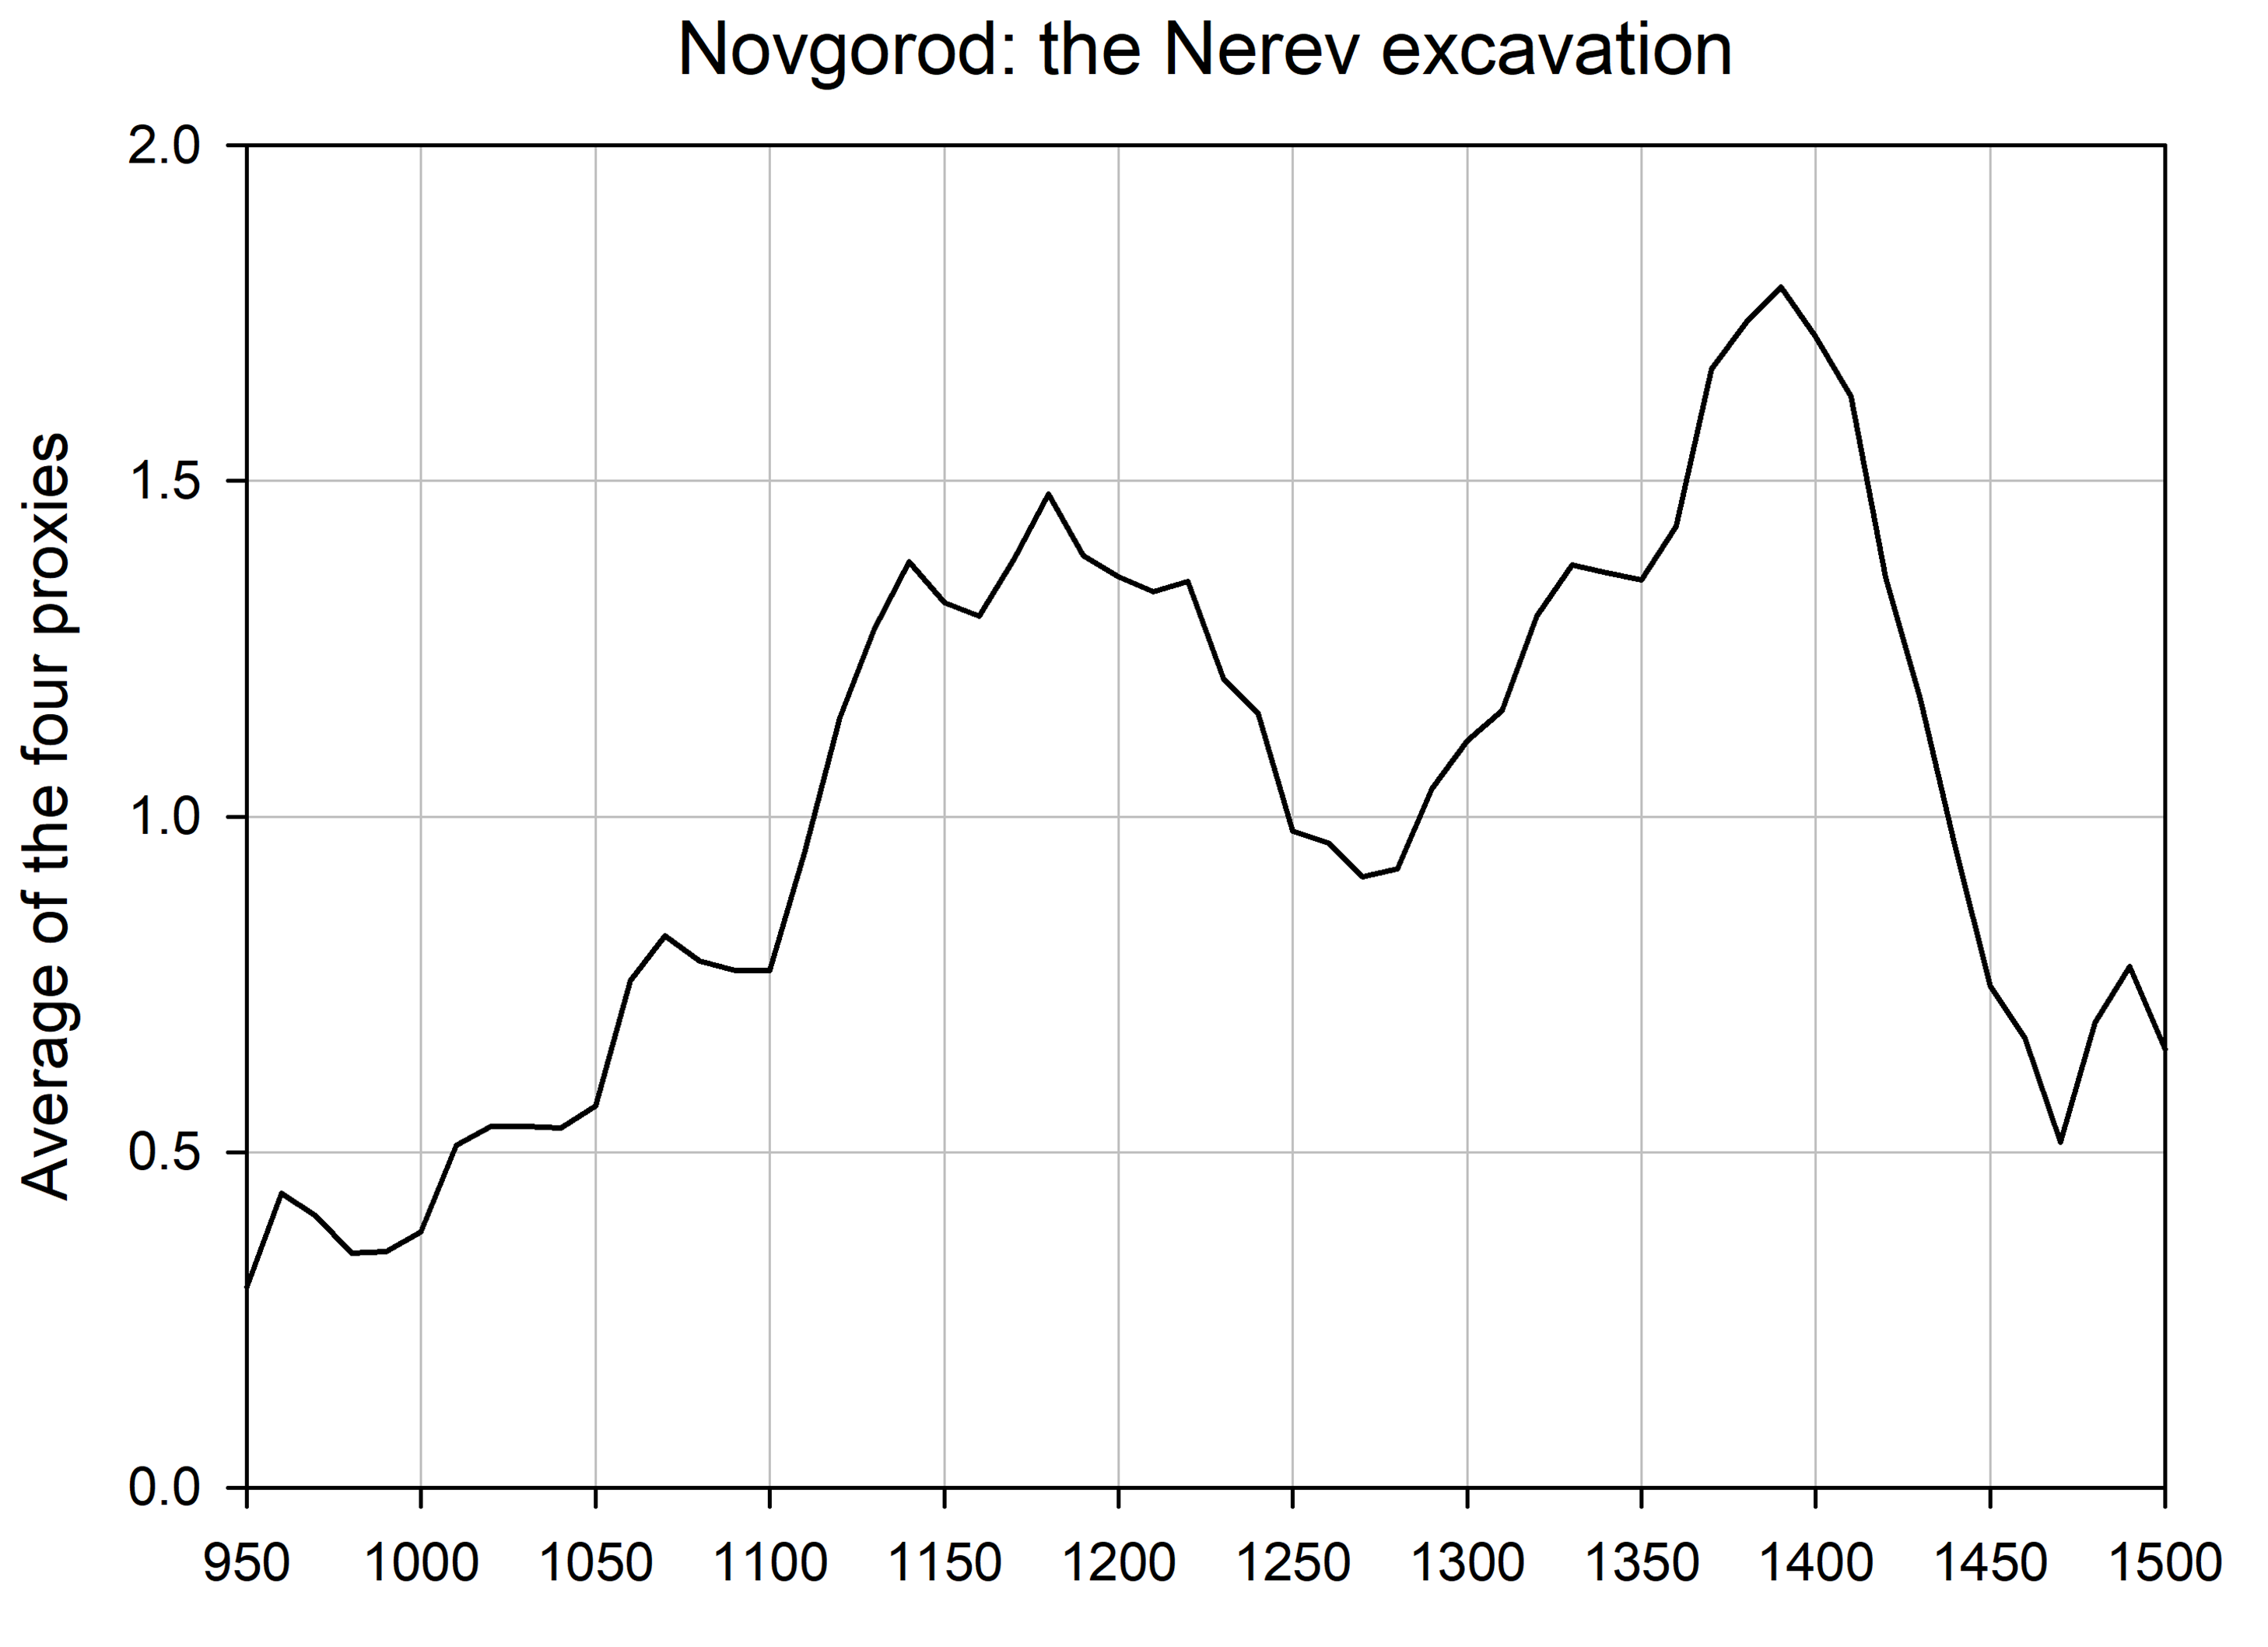
Analysis by the author
Furthermore, there is a variety of other qualitative and some quantitative data that support the interpretation that Novgorod population went through two secular cycles between 950 and 1500. As an example, let’s take a look at birchbark documents, such as the one shown below.
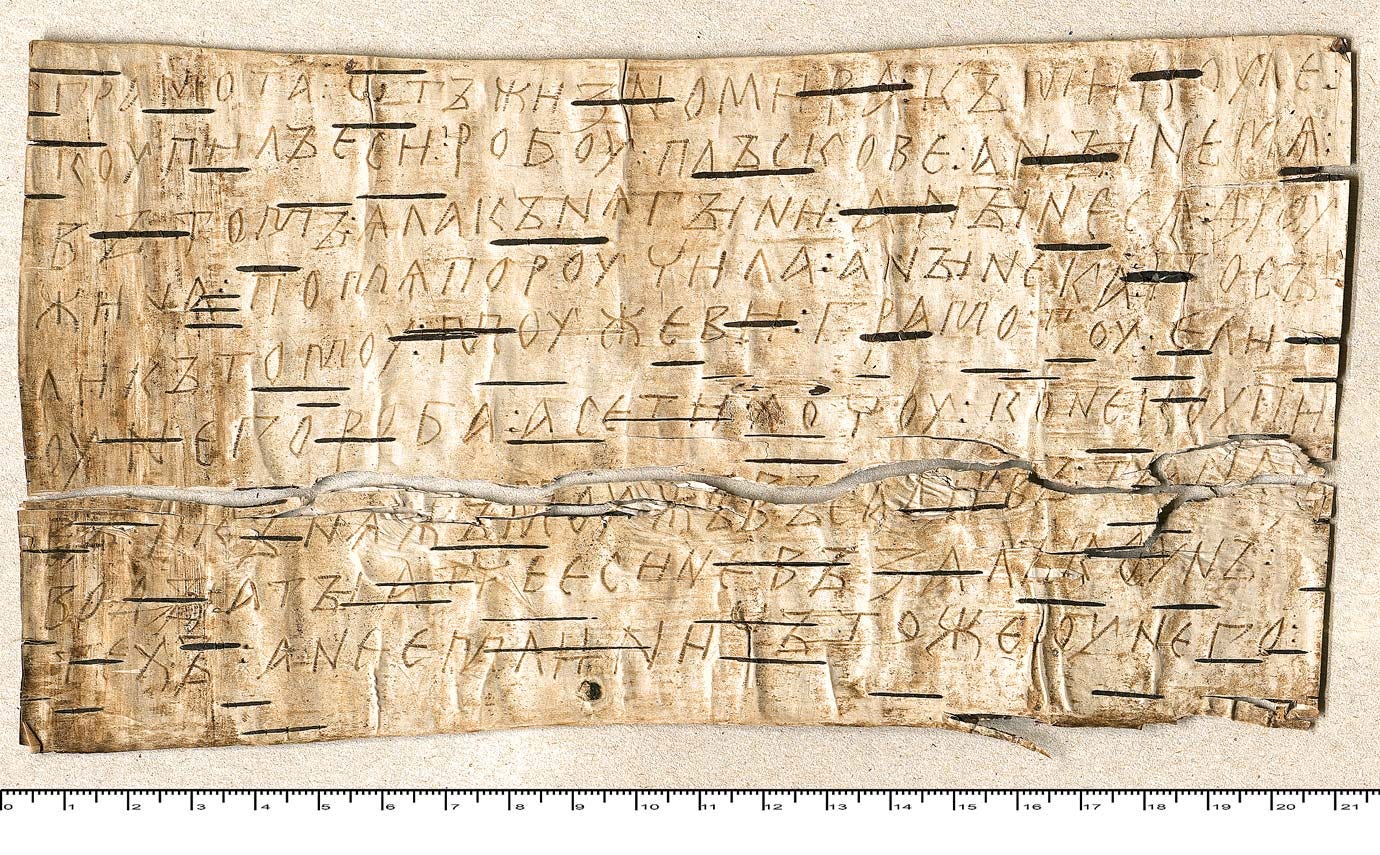
The Novgorodians were a remarkably literate nation. Most men and a substantial proportion of women could read and write. Many Novgorodians carried with them a bunch of blank pieces of birchbark and a bone stylus. When the need for a communication arose, they inscribed the letter and sent it to the intended recipient. Those, after reading the message, often simply tore it in two and dropped it in the mud, where it would be preserved for centuries to be discovered by archaeologists.
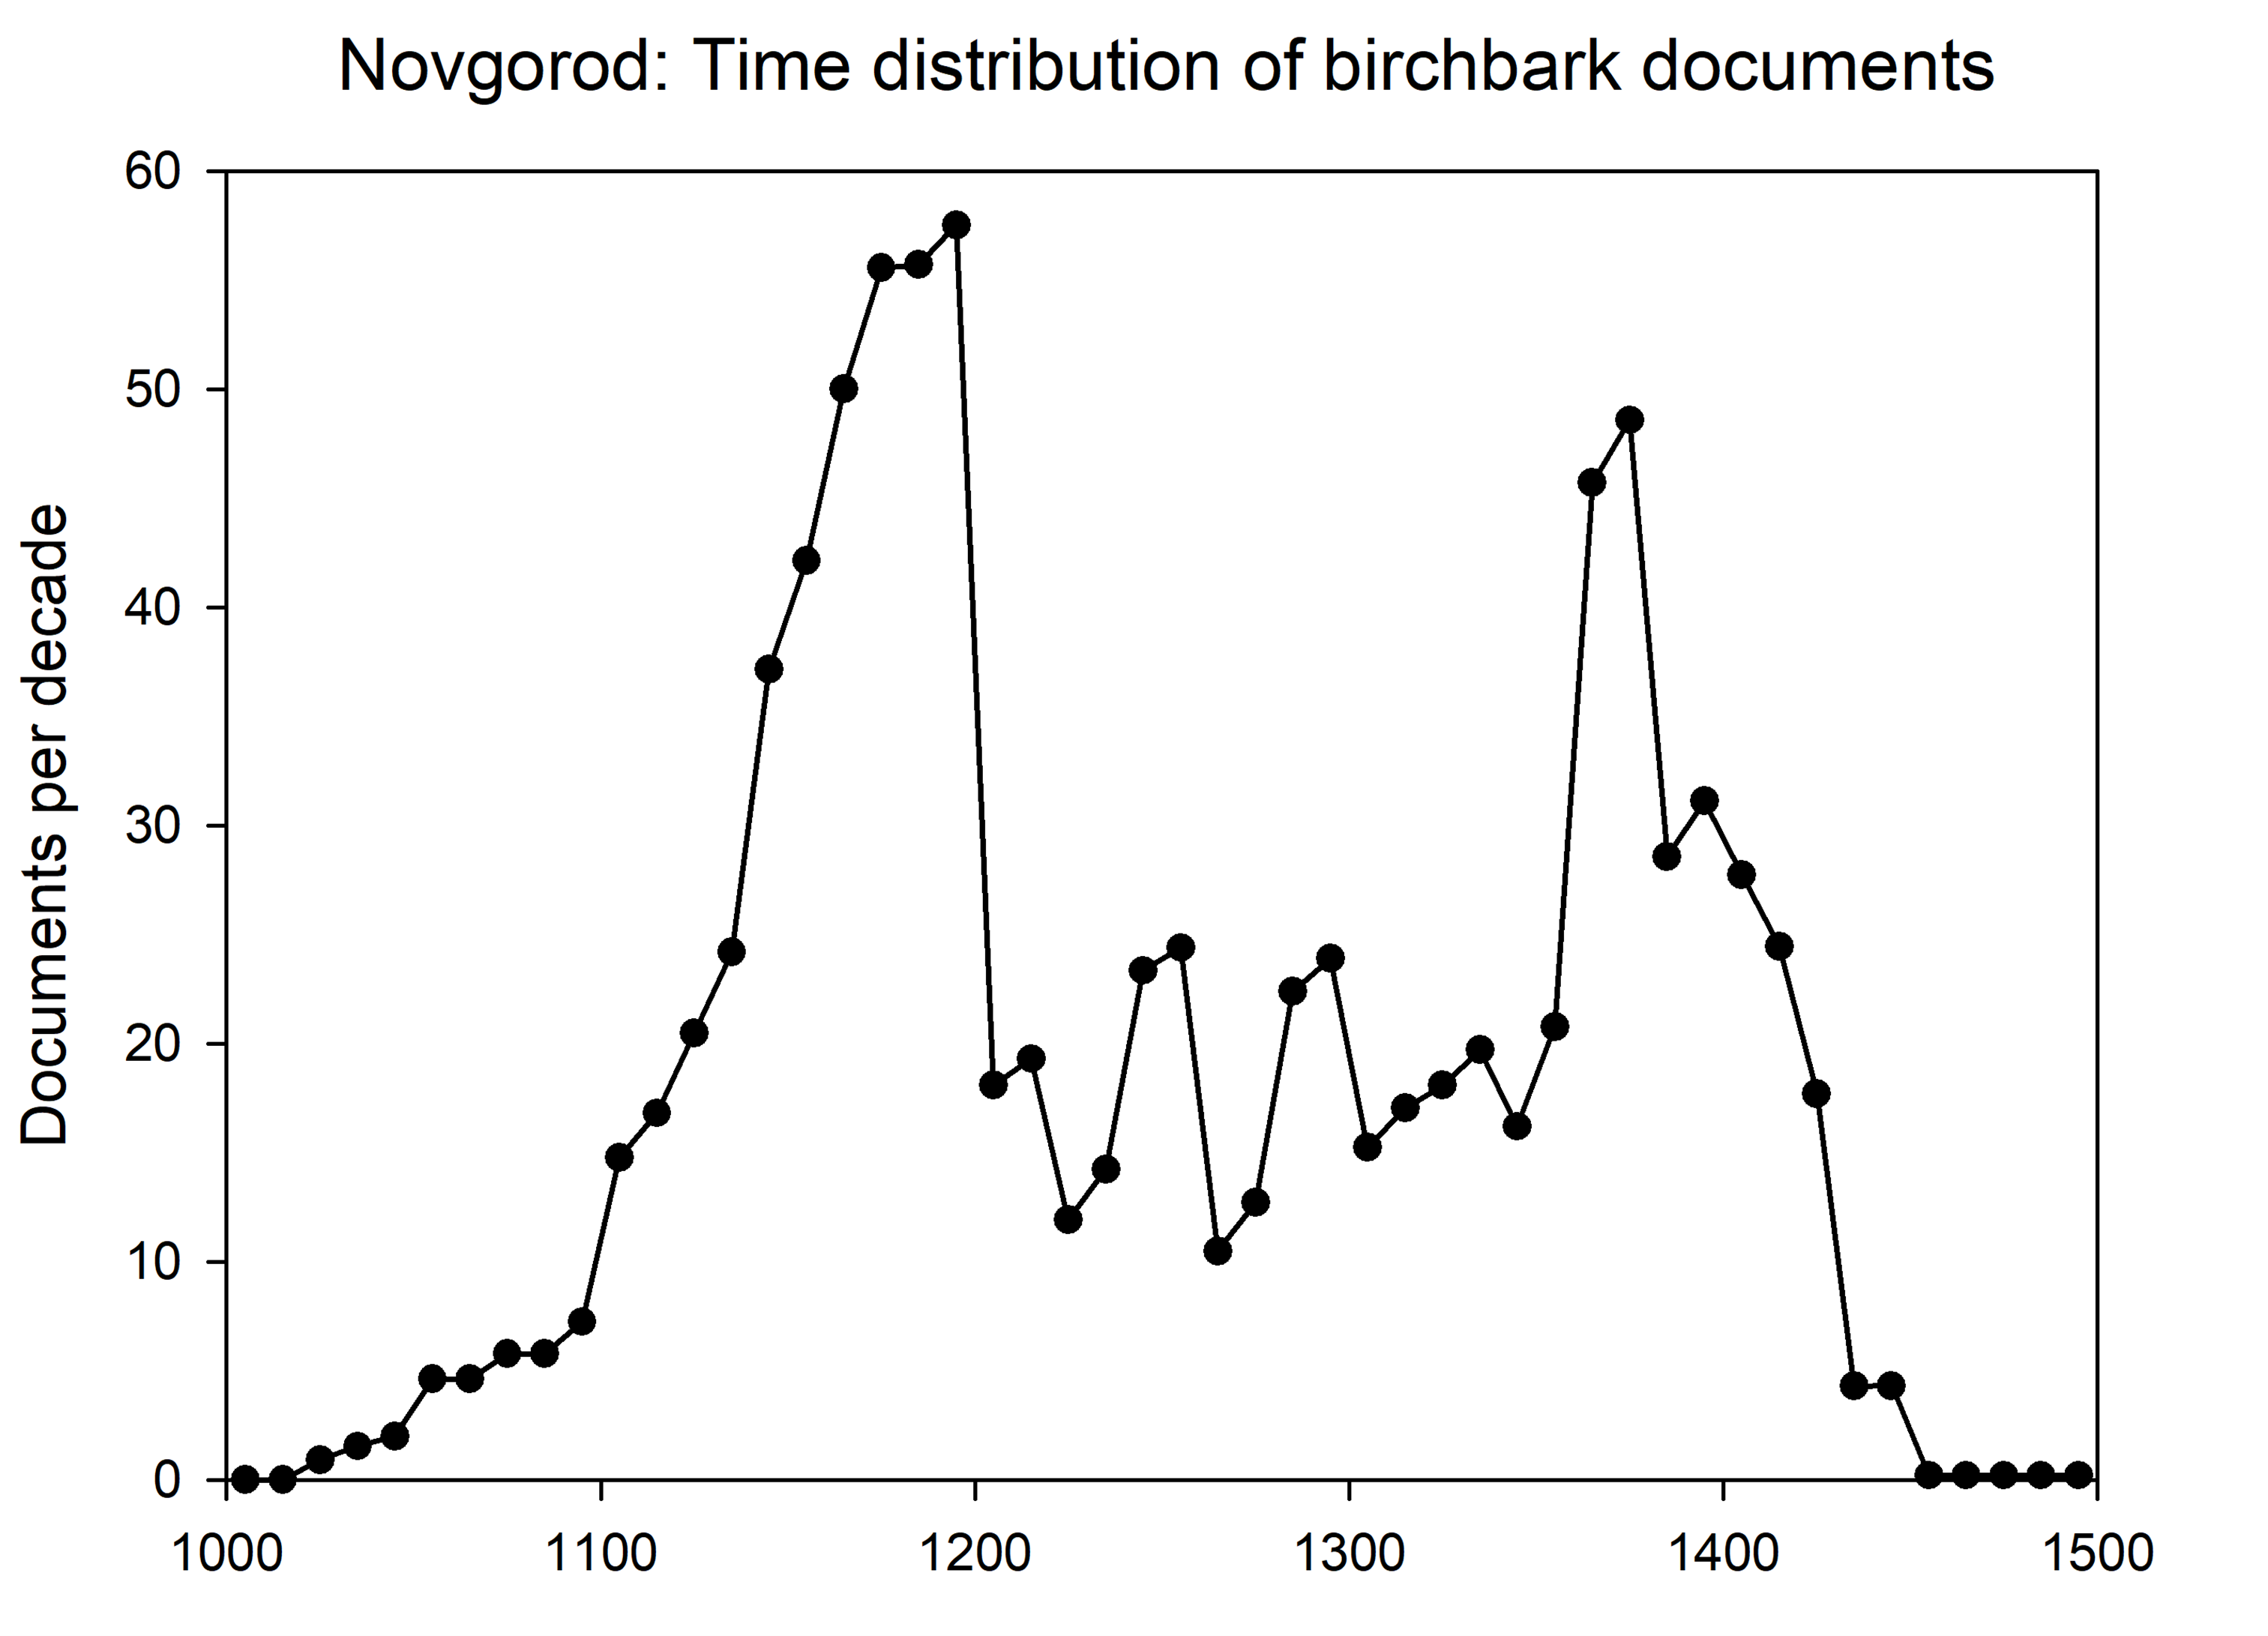
This graph shows the time distribution of birchbark documents, discovered in the Novgorod excavations. We see the same two cycles as in the “stuff” data. However, collapses in document production are more abrupt than population declines. A possible interpretation of this pattern is that literacy rates declined even more than population levels. Since becoming literate in those times was associated with aspiring for upper mobility, perhaps declining literacy (and birchbark document production) was due to reduced intra-elite competition. This is quite speculative, but there are parallels in early modern Britain, where enrollment in Oxford and Cambridge peaked just before the onset of the English Civil War, and declined during the 18th century.
Notes on the margins: The past week was all consumed by travel. First to Paris for Cliodynamic events, and then to Marrakesh, where we are now ensconced for the next five weeks.
I wonder whether the population variance could be fitted to outbreaks of the Black Plague? that assumes that the plague extended that far North, of course....