Immiseration: Psychological and Social Dimensions
The quantity and quality of data on such dimensions of well-being are getting better and better
Broadly-based well-being is a key variable in the structural-demographic theory, while its opposite, popular immiseration, is one of the most important drivers for instability. (Remember, inequality is not a fundamental driver in this theory, but rather a useful proxy for joint development of immiseration and elite overproduction.)
When discussing trends in immiseration, the tendency often is to focus exclusively on a single dimension. Economists, in particular, mostly care about how household incomes or wealth change with time. But more recently even economists started paying attention to other dimensions of well-being. A good example is the team of Anne Case and Angus Deaton, who introduced in the general usage the notion of “deaths of despair.”
My approach from the very beginning emphasized the multi-dimensional nature of well-being. An exclusive focus on its economic aspect, in my view, is counter-productive. First, measuring how “real” (inflation-adjusted) wages and incomes change over time is a highly technical undertaking. Depending on how one approaches it—the mean versus the median, wages versus incomes, different inflation measures—can result in very different trends, even moving in opposite directions. Second, for most past societies (e.g., before 1800) we simply lack the detailed economic data to construct such time series.
For these reasons, from the very beginning, in my work I’ve tried to look at a broad variety of measures. One particularly useful kind of data is on biological measures of well-being. Some aspects, such as life expectancy, are difficult to estimate for past societies. But data on other measures, such as average stature (height) or prevalence of degenerative diseases, are much more available. There are literally millions of skeletons in European museums, and they yield a variety of rich data on personal health and interpersonal violence. See, for example, the book The Backbone of History: Health and Nutrition in the Western Hemisphere.
Yet another dimension of well-being that has been difficult to assess is its psychological and social aspects. Fortunately, this is changing. For example, Angus Deaton, whom I’ve already mentioned in this post, was a co-author on a 2010 article, A snapshot of the age distribution of psychological well-being in the United States. Analyzing data collected in 2008, these authors discovered that the curve of psychological well-being is U-shaped. From a relatively high level characterizing the 20-year old, it declined for those aged between 20 and 50 years, and then increased again, so that octogenarians (80-year old) reported a higher satisfaction with life than the young adults.
Well-being (WB) plotted against age (Stone et al. 2010: Figure 1)
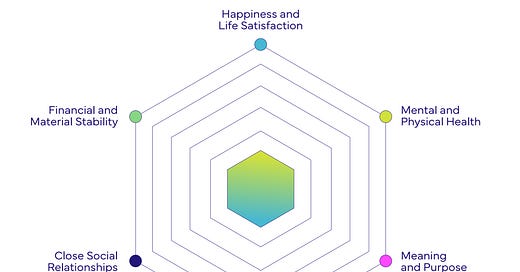
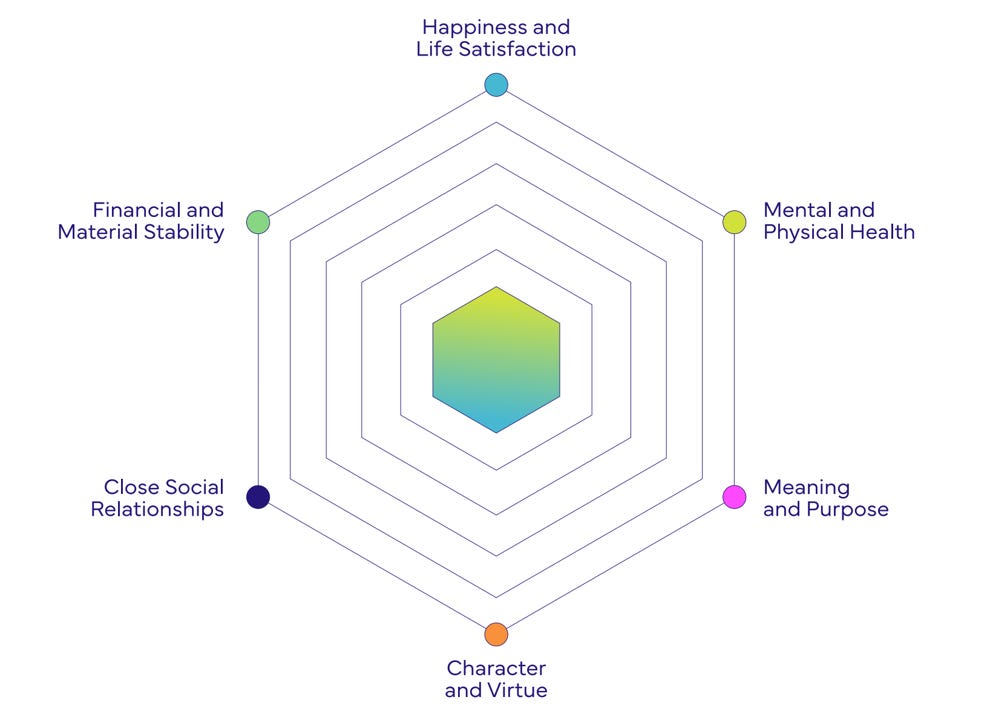
Very interesting. But it turns out that this U shape is not a universal feature, as was initially thought. Recently the Global Flourishing Study published analysis results of a massive data set for over 200,000 people in 22 countries. Their approach to quantifying “flourishing” was quite comprehensive and included six core domains:
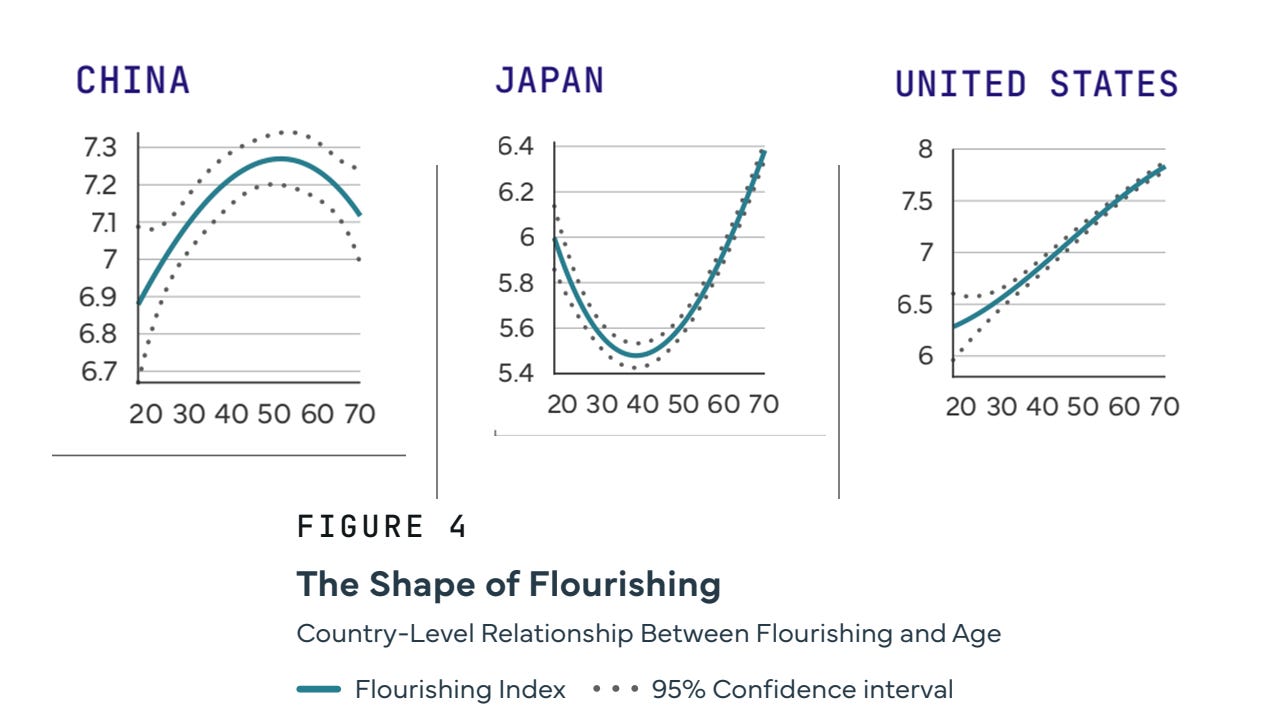
They found that “flourishing” can change with age in pretty much any imaginable way: increasing, decreasing, increasing-then-decreasing, and so on. In the United States, for example, the previously observed U-curve changed into an ascending line.
The problem with such snap-shot studies is that they confound age effects with “cohort effects” (how a variable changes over time). I haven’t analyzed these data, but I suspect that the ascending line in the US is a result of putting together people who, when 20, experienced the 1950s and 60s, which were happy times; and people who were 20 during the last two decades, when immiseration has reached new heights. This hypothesis would also explain why in Japan we see the U-shape, with the least happy 40-somethings who fully experienced the Japan’s lost decades. In China the curve is flipped, with the happiest cohort being 50-year old. These folks lived through the most amazing upsweep in well-being. I repeat, this is a hypothesis, which needs to be tested by analyzing data in which a cohort is followed through time.
One other thing to note is the amazingly low overall level of flourishing in Japan. Note the scale (vertical axis). In Japan the flourishing index varies between 5.4 and 6.4, which is well below the ranges for the US and, especially, China. Relevant to this observation, a colleague of mine and I are close to finishing a structural-demographic analysis of contemporary Japan, which indicates that the Japanese society is truly in dire straits. I will write here when this study’s results are ready to be shared.


So refreshing to see measures other than GPD per capita
I agree that the cohort effect deserves close attention. At the same time, I wonder what patterns might emerge if we tracked the wellbeing of “elites,” “counter-elites,” and “non-elites” across different phases of the long cycle.
It would be fascinating to see whether popular immiseration ever creates perceptible ripples for elites during periods when they remain economically insulated. Does collective angst ever bleed through to the polo club? And if it doesn’t—what forms of rationalization or symbolic containment are required to keep the psychic tremors at bay?
I suspect the costs of these insulation strategies—to those deploying them—are more than economic. What I’m pointing to, I think, is the porous membrane between your domain and mine: where structural-demographic stress meets the inner architecture of coherence and breakdown. It’s a boundary I’ve been exploring in my own recent work as you know.